DP20 Getting Results from Sparse Matrix
Description
This script is designed to process a large matrix of periods and medical conditions, allowing for the export of summarized values to Power BI for dynamic visualization.
The script includes a function to convert the matrix of periods and conditions into a list format using reshape2::melt. Lastly, it utilizes Dcast or group_by operations to produce the final results.
Link to the Complete Script in Github
R Script - Recap of Sparse Matrix
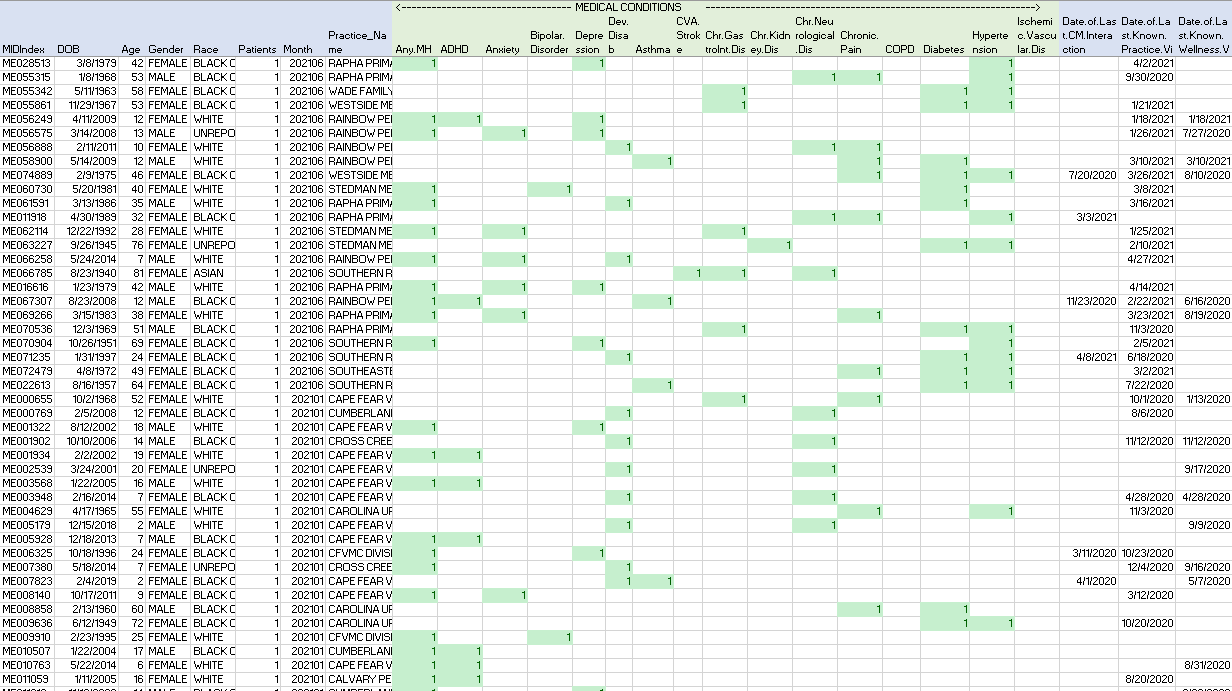
Initial Source. View of the CSV file in Excel.
The following is a preview of the initial CSV data presented as an Excel spreadsheet:
Function to Convert the matrix into a list
Use of data.table::melt reshaping tool.
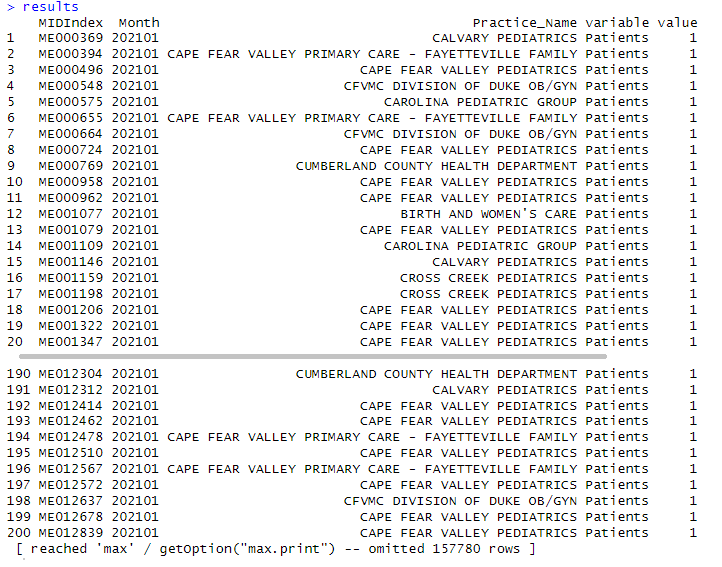
All the medical conditions fields will be listed in a single column “variable”. The variable “patients” is the total number of enrollees that will serve as the denominator when creating percentage parameters.
1
2
3
4
5
6
7
8
9
10
11
12
13
14
15
16
# Function Melt Each Group of Conditions by Month and Practices
fx_melttables <- function(vectorconditions, dfdata){
  dffinal <- data.frame()
  dfdata <- data.table(dfdata)
  for(i in seq_along(vectorconditions)){
    print(vectorconditions[i])
    melted1 <- data.table::melt(dfdata, id.vars = c("MIDIndex", "Month", "Practice_Name"),
                    measure.vars = vectorconditions[i])
    dffinal <- bind_rows(dffinal, melted1)
  }
  dffinal
}

### Applying the fx and summarizing the results to data
### "dtRECAP" and a group of medical conditions in vectorcond.
results <- fx_melttables(vectorcond, dtRECAP)
Melted Data: Head
The resulting data frame has 157,980 rows resulting from 7899 rows from data multiplied by 20 variables.
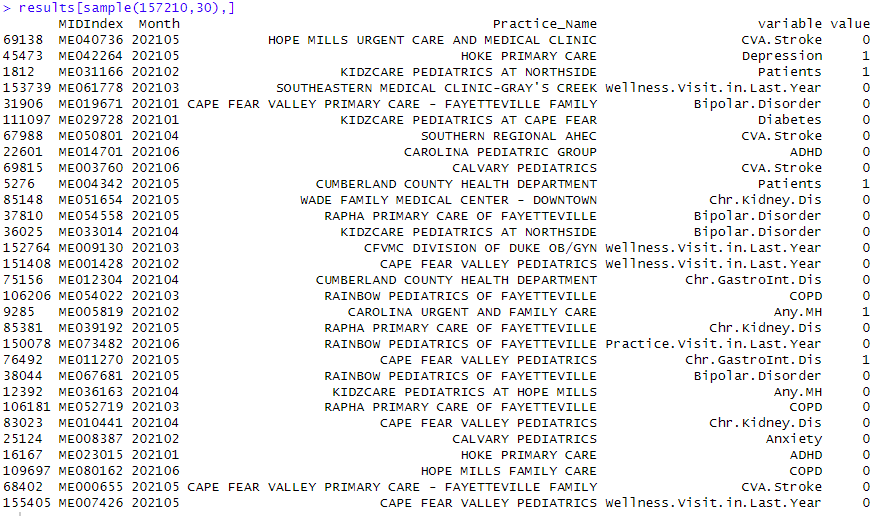
Melted Data: View of a random sample of 30 results.
Most of the results have a value equal to zero representing the blank cells in the Excel view.
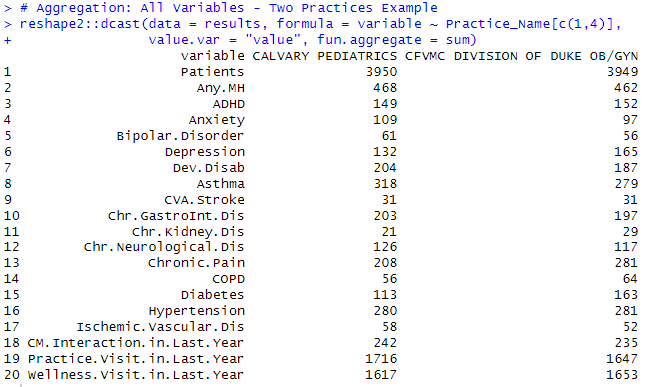
Aggregation of All Variables for Two Practices Example
Using reshape2::dcast
1
2
3
# Aggregation with dplyr::dcast
reshape2::dcast(data = results, formula = variable ~ Practice_Name[c(1,4)],
                value.var = "value", fun.aggregate = sum)
Result: Data Table - Recap of all variables - Two Practices example
Aggregation for All variables - All Months
1
2
3
# Aggregation: All variables - All Months
reshape2::dcast(data = results, formula = variable ~ Month,
                value.var = "value", fun.aggregate = sum)
Result: Data Table - Recap of Patients per Month 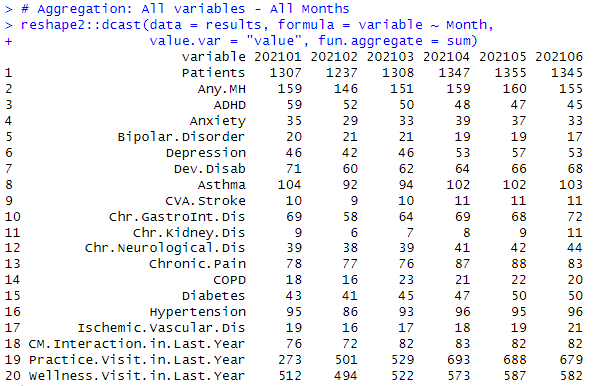
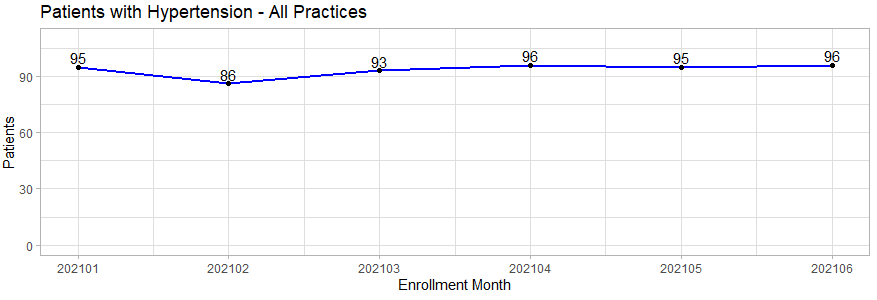
Line Plot Patients with Hypertension
This code shows a ggplot geom_line as an example of patients with hypertension by month.
1
2
3
4
5
6
7
8
9
10
11
12
13
14
15
# LinePlot (ggplot2) for one Condition (Hypertension)
dfHypertension <- results %>% filter(variable=="Hypertension") %>%
  group_by(Month, variable) %>%
   summarize(ptsHTN = sum(value), .groups = 'drop')

# Basic Line
ln <- ggplot2::ggplot(data=dfHypertension,
             aes(x=Month, y=ptsHTN, group=1, label=ptsHTN)) +
  geom_line(color="blue",linewidth=1) +
  geom_point()+ geom_text(nudge_y = 5) +
  ggtitle("Patients with Hypertesion - All Practices")

# y-axis limits
ln +  ylim(0,110)+
theme_light() + labs(x="Enrollment Month",y="Patients")
Line chart: Patients with Hypertension
Aggregation All Variables - Months - Practices
This is the table to export that will serve as a source for a PowerBI dashboard:
1
2
3
totaltable <- results %>% group_by(variable, Month, Practice_Name) %>%
  summarize(Enrollees = sum(value), .groups = 'drop')
print(totaltable[sample(3840,30),],n=30)
Results to export to PowerBI 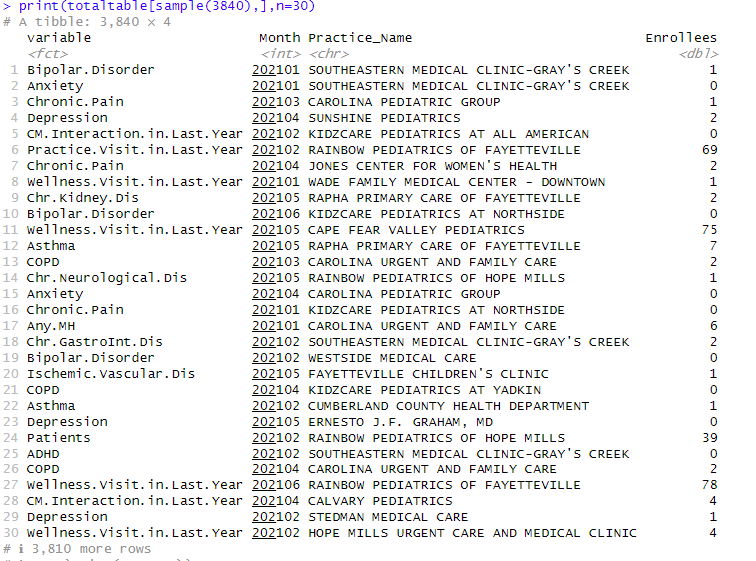
Data Mining Patients with specific conditions
The next shows the results looking for patients filtered by medical conditions, months, and practice.
1
2
3
4
5
# * 6.1 Data Mining List of Patients with Hypertension
results %>% filter(variable== "Hypertension",
                   Month== "202105",
                   value == 1,
                   Practice_Name == "HOKE PRIMARY CARE")
Results: ID of 8 patients 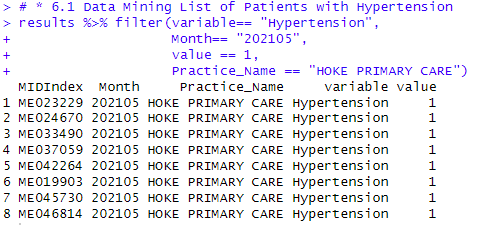
__
End of Post