01. Enrolled Population in the Last 18 months
Published Monthly years 2018 - 2021.Last Published: June 18, 2021. 7 pages. Link: Enrolled Population in the Last 18 months
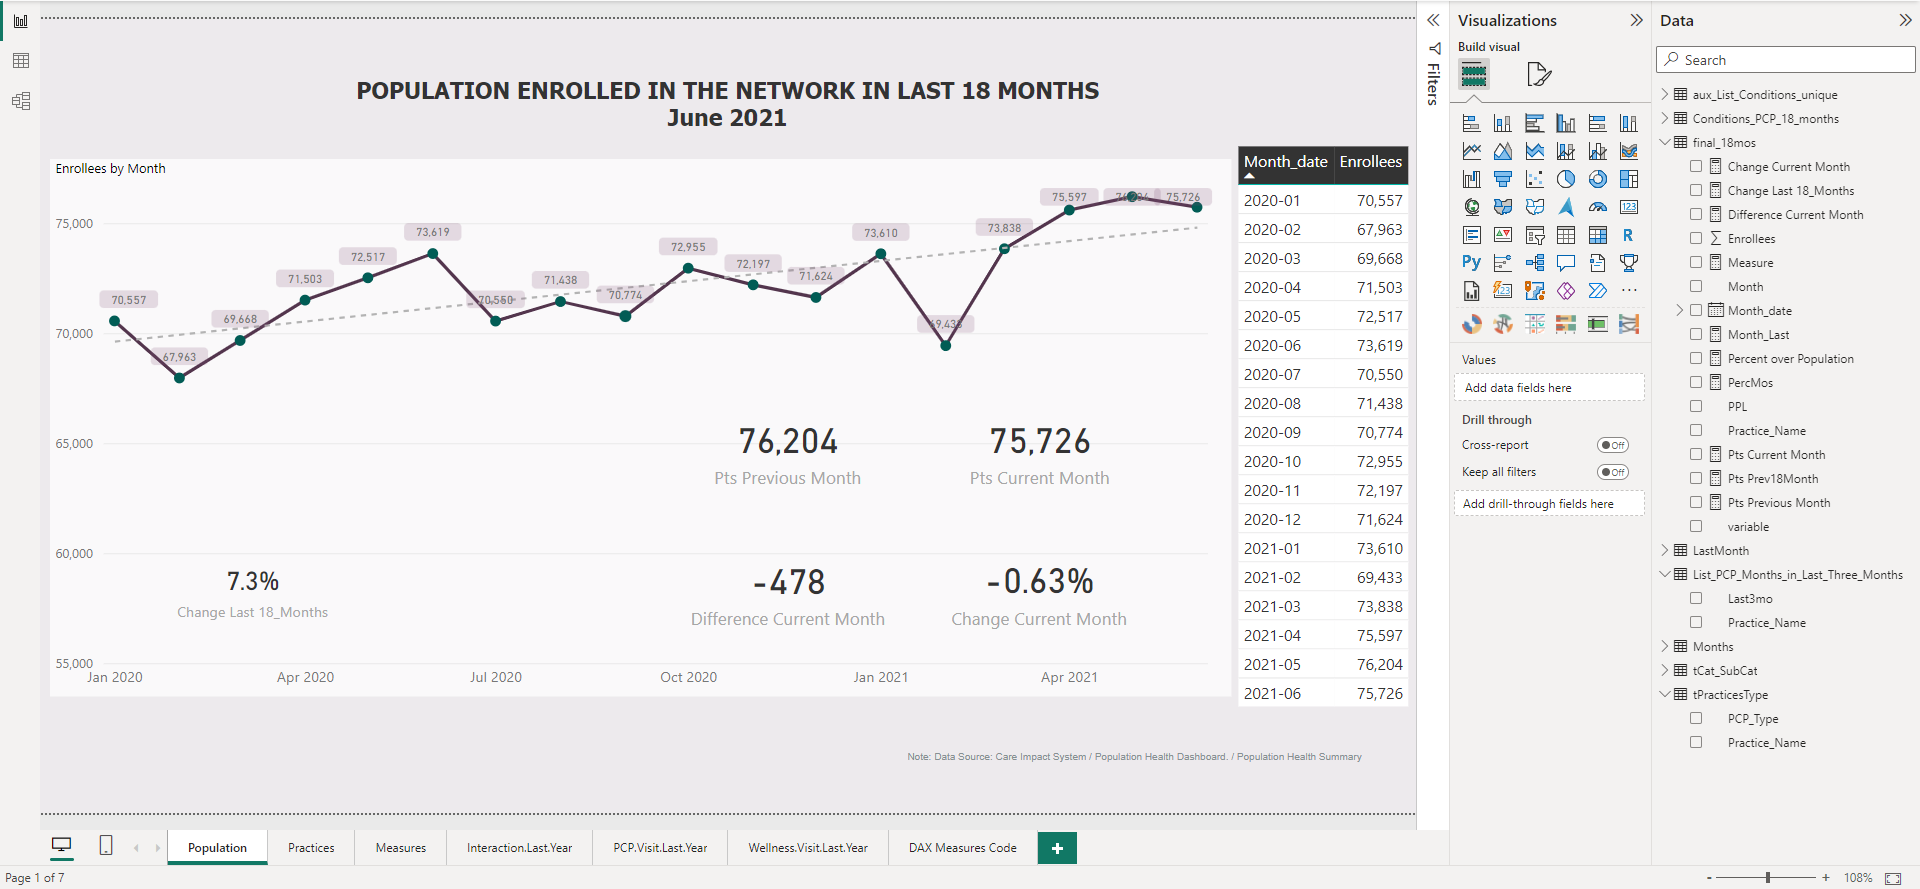 01_Screen_Enrollees_in_Last_18mos
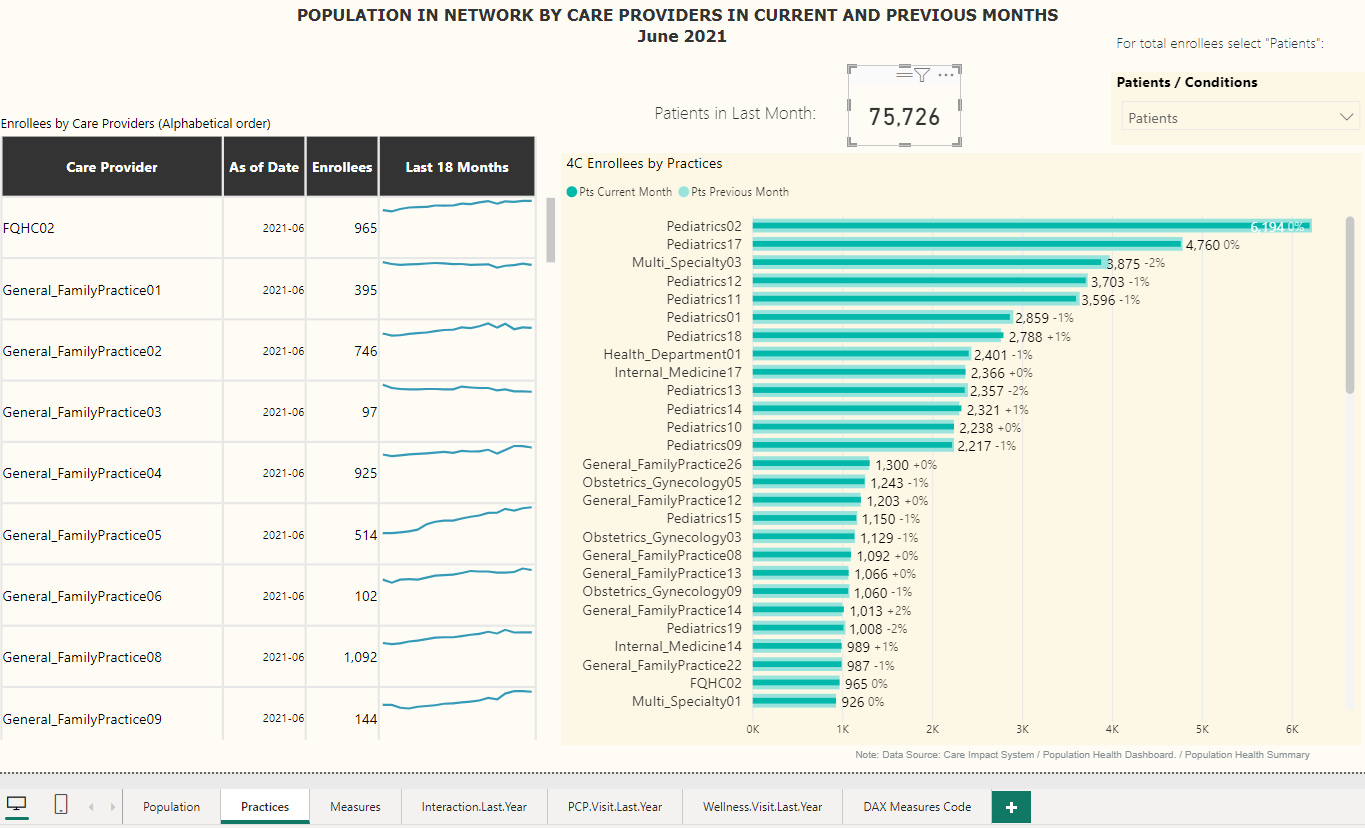 02_Population_in_Network_by_Care_Providers_in_Current_and_Previous_Months
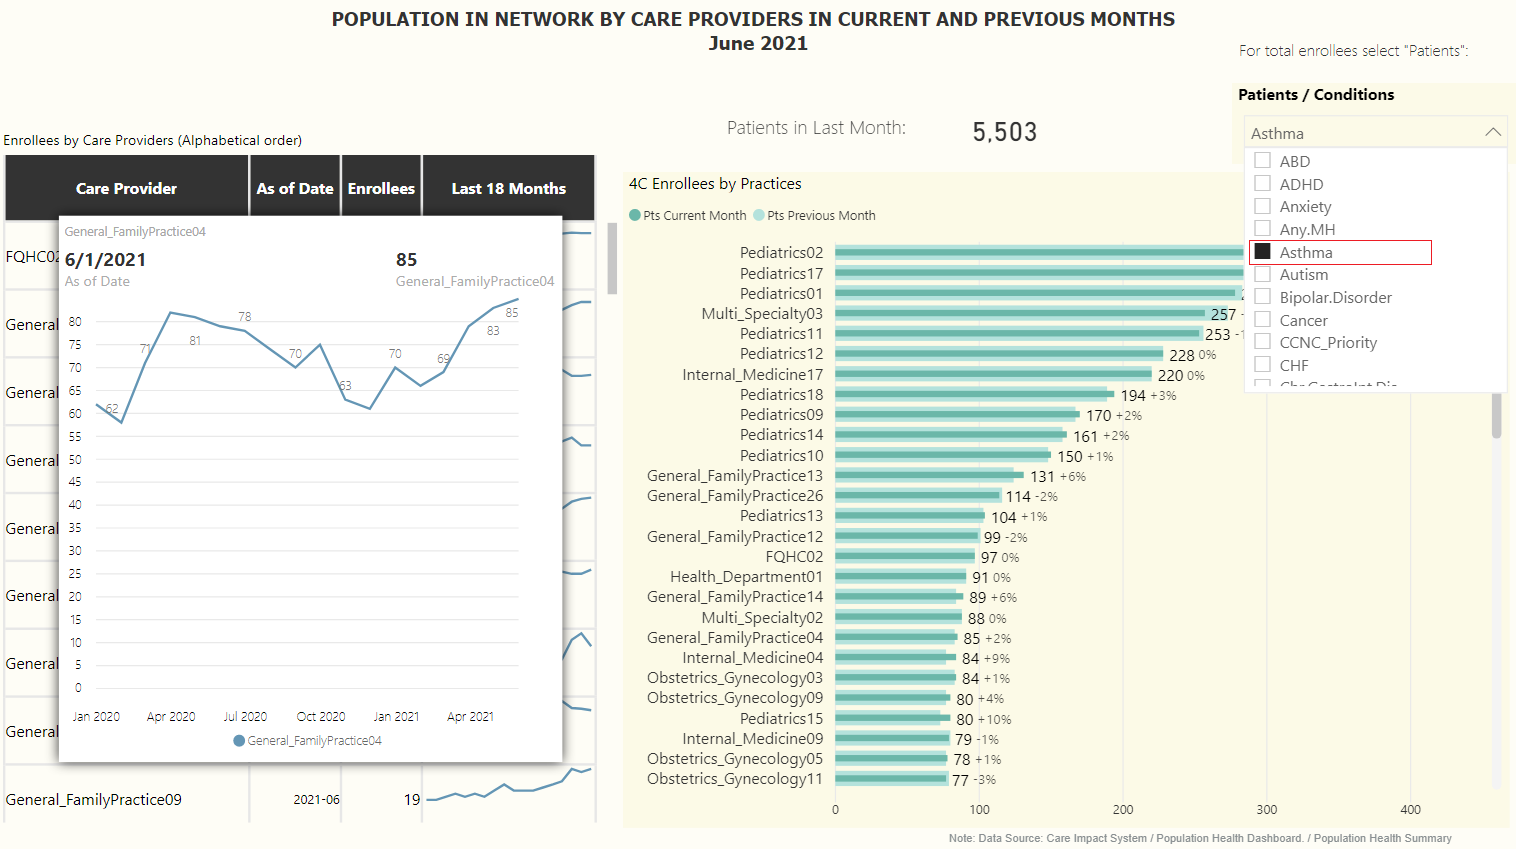 03_Population_by_Care_Providers_for_Asthma_Condition
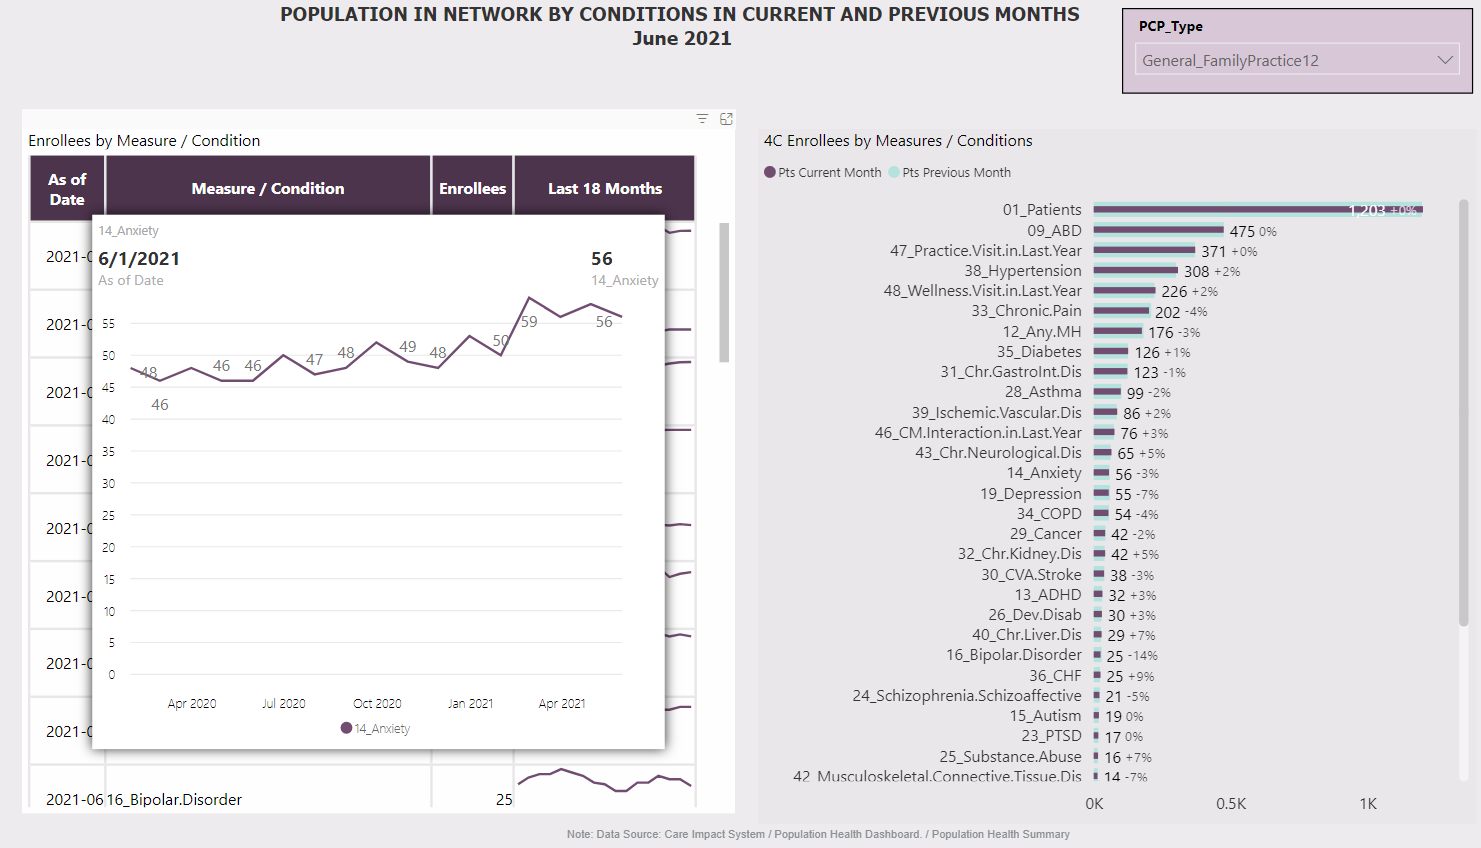
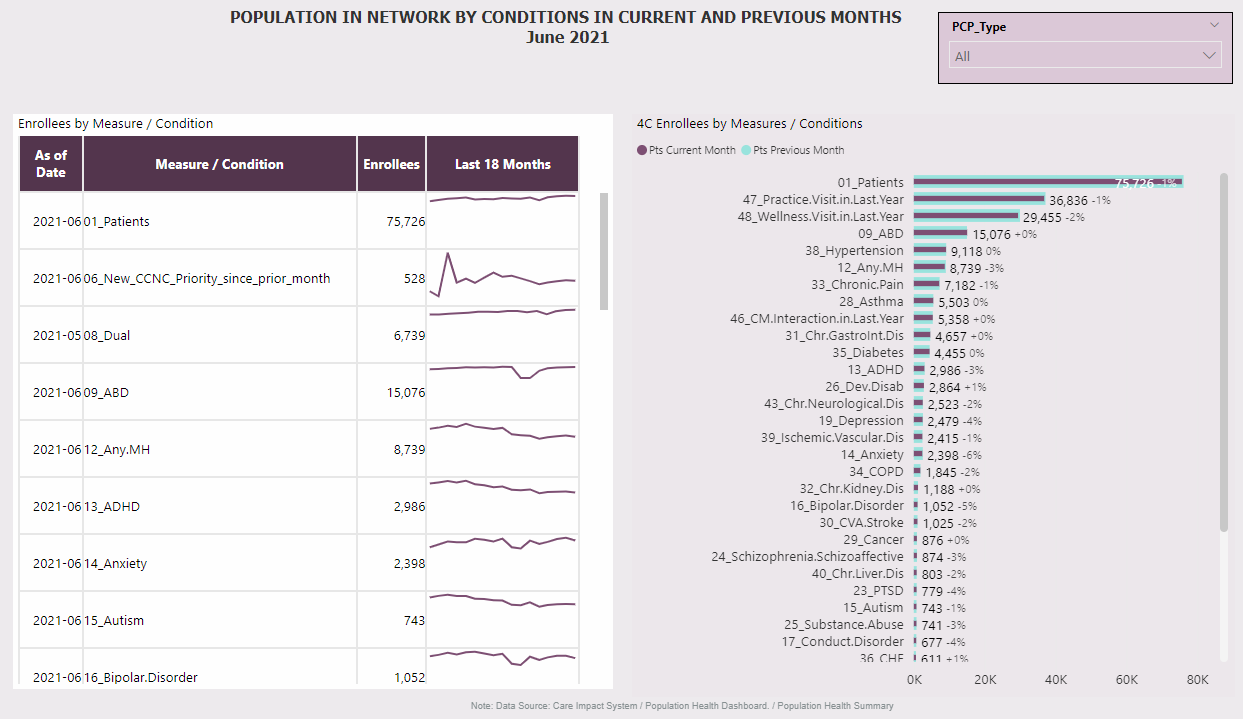 04_Population_in_Network_by_Conditions_in_Current_and_Previous_Months
 05_Patients_One_Care_Providers_All_Conditions_Detail_Anxiety
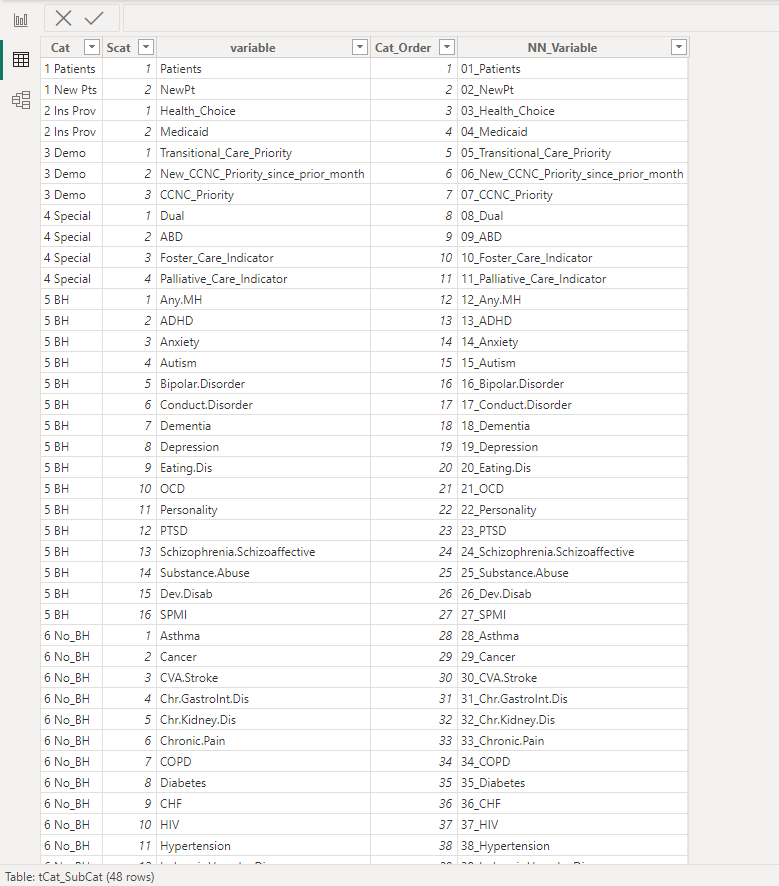 06_Table_View_Example
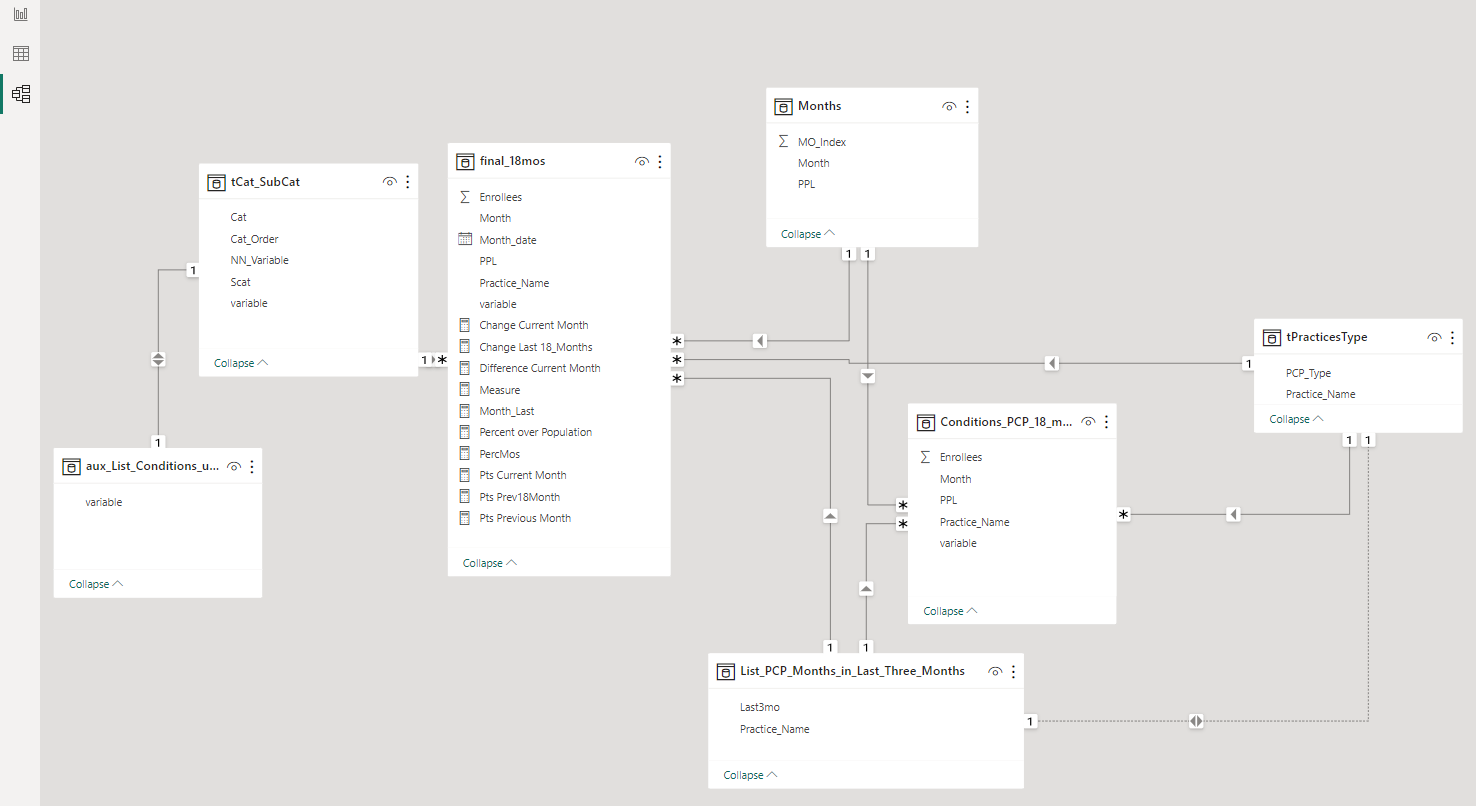 07_Model_View_Conexion_of_Tables
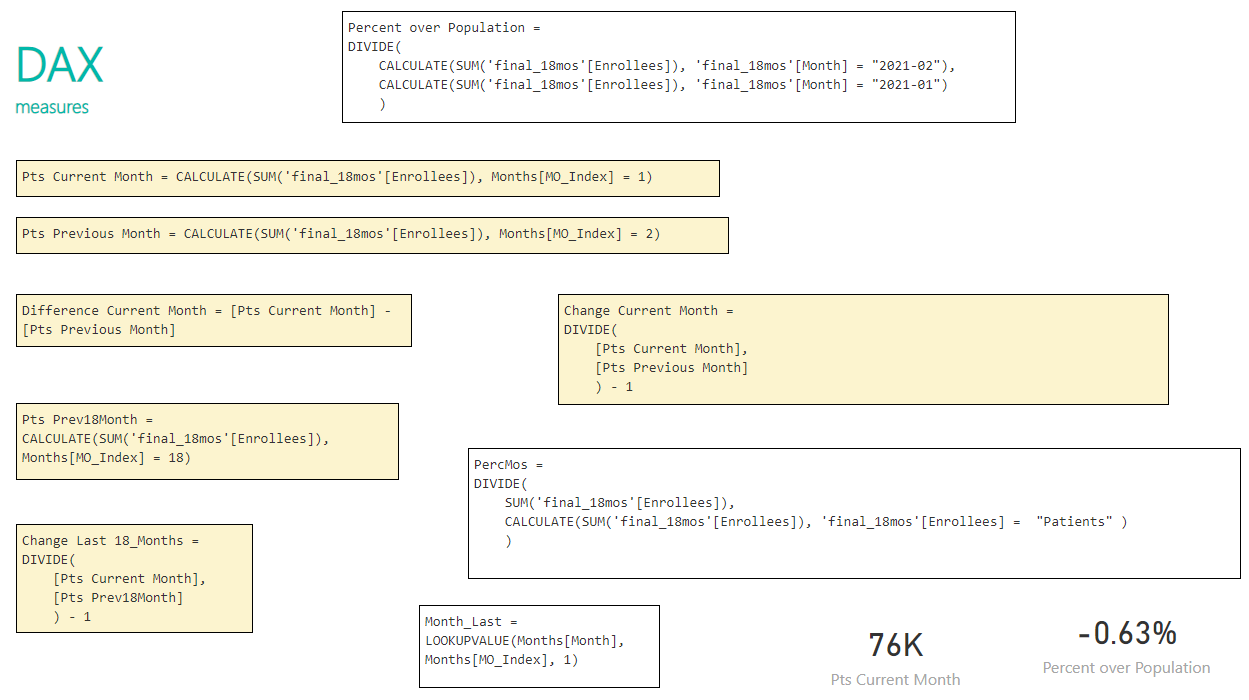 08_DAX_code_for_measures
02. Demographics Conditions Network Population
Published Monthly years 2018 - 2021.This version published: December 02, 2020. 1 page. Link: Demographics and Conditions for Population in Network
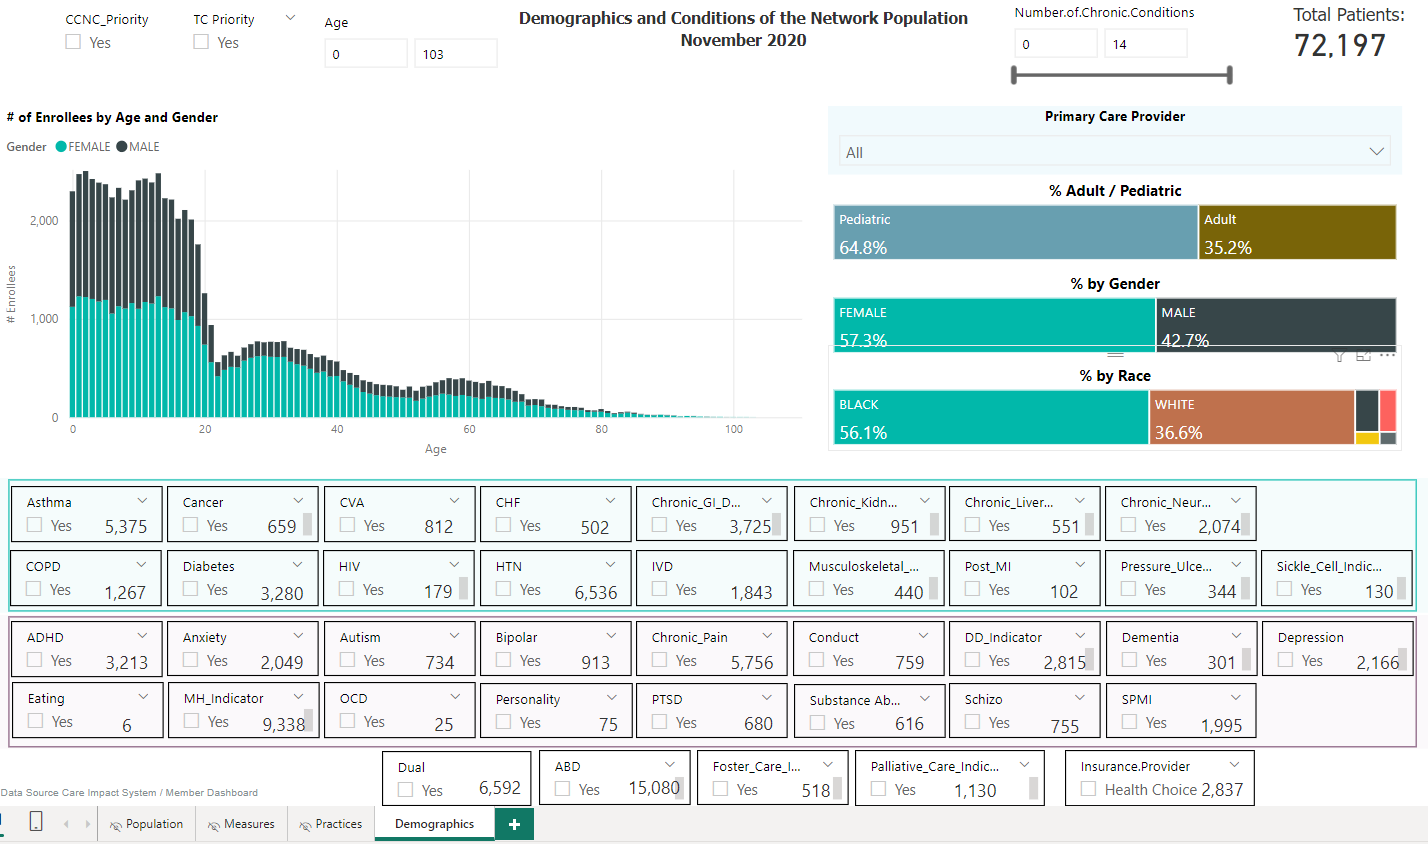 01_Demographics and Conditions for Population in Network
03. Review of Utilization Rates: Emergency Visits, Inpatient Visits, Readmissions
Published year 2021.This version published: August 31, 2021. 17 pages. Link: Review of Utilization Rates: Emergency Visits, Inpatient Visits, Readmissions
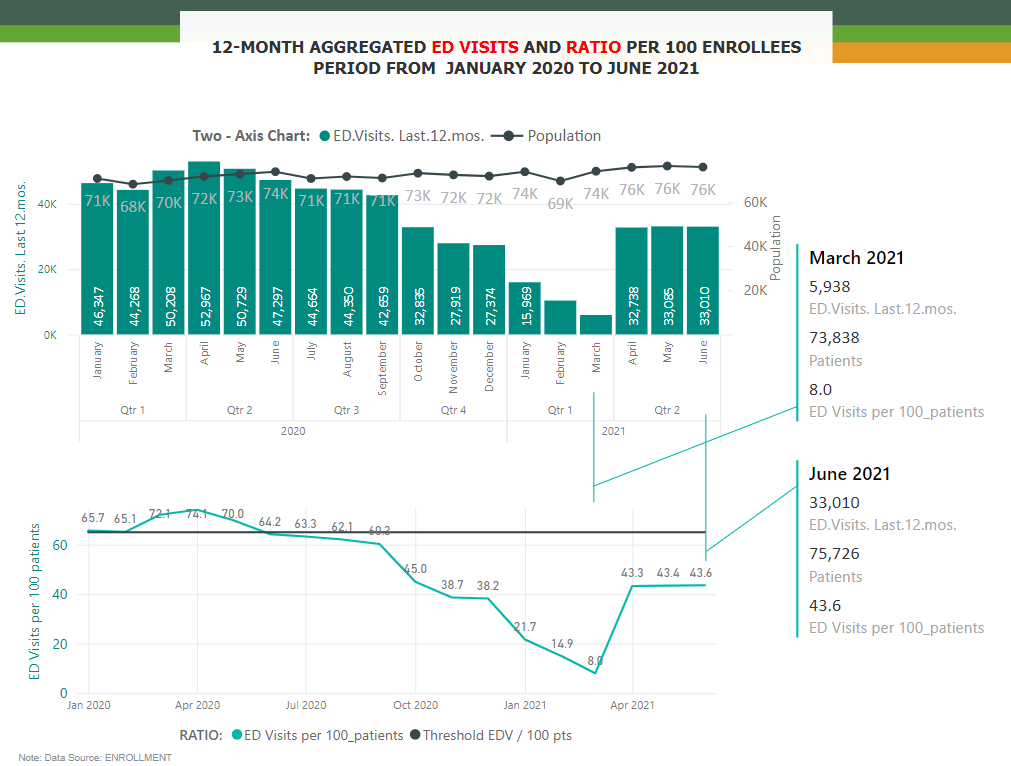 01_ED_Visits
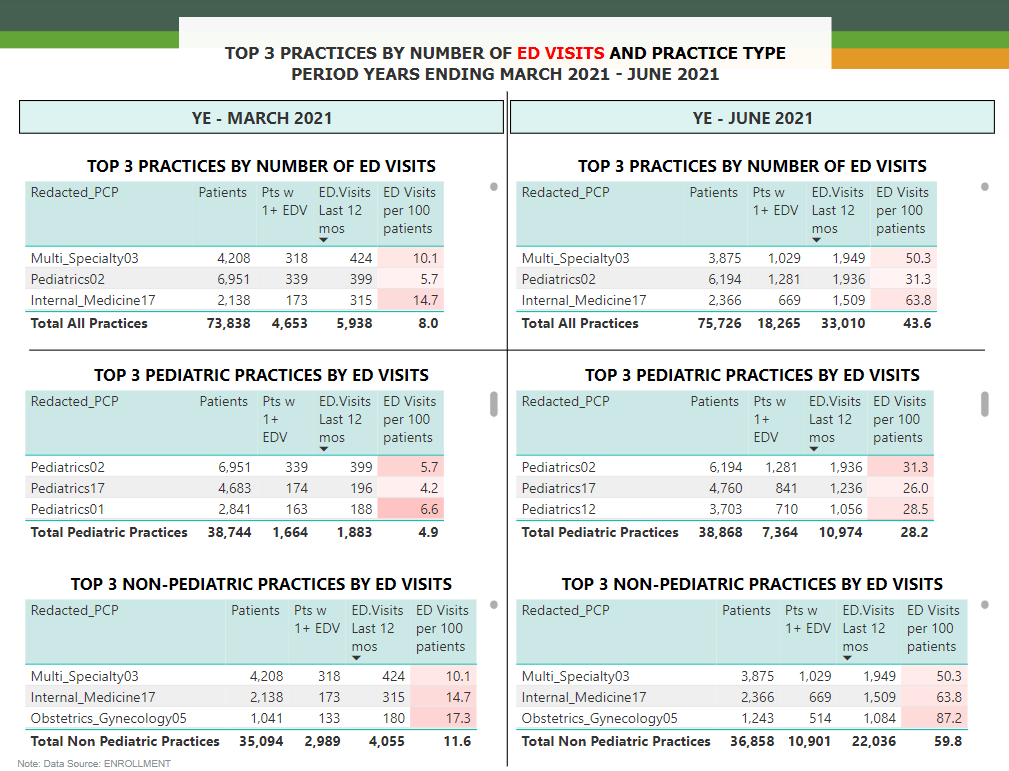 02_Top_3_ED Visits
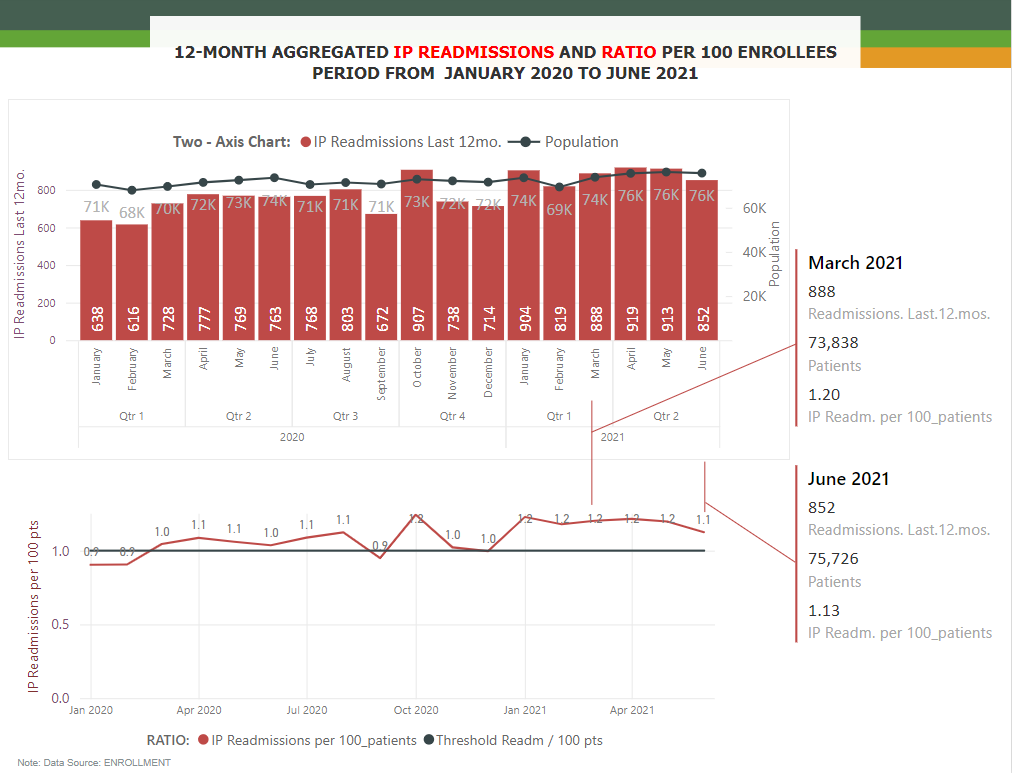
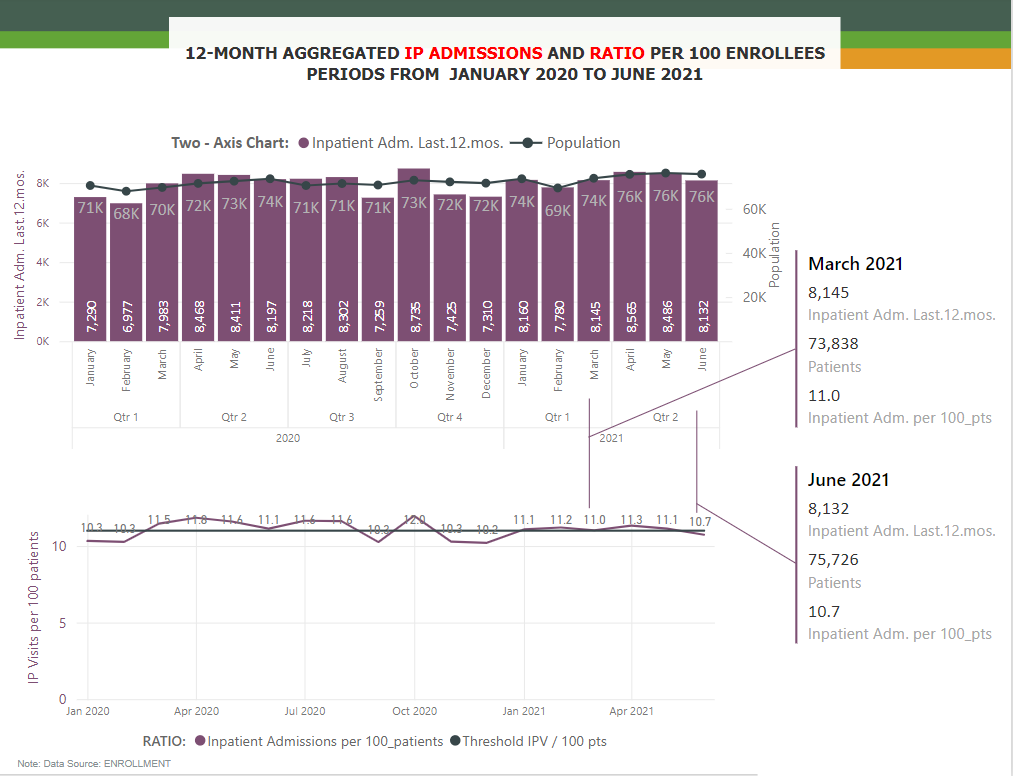 03_IP_Visits
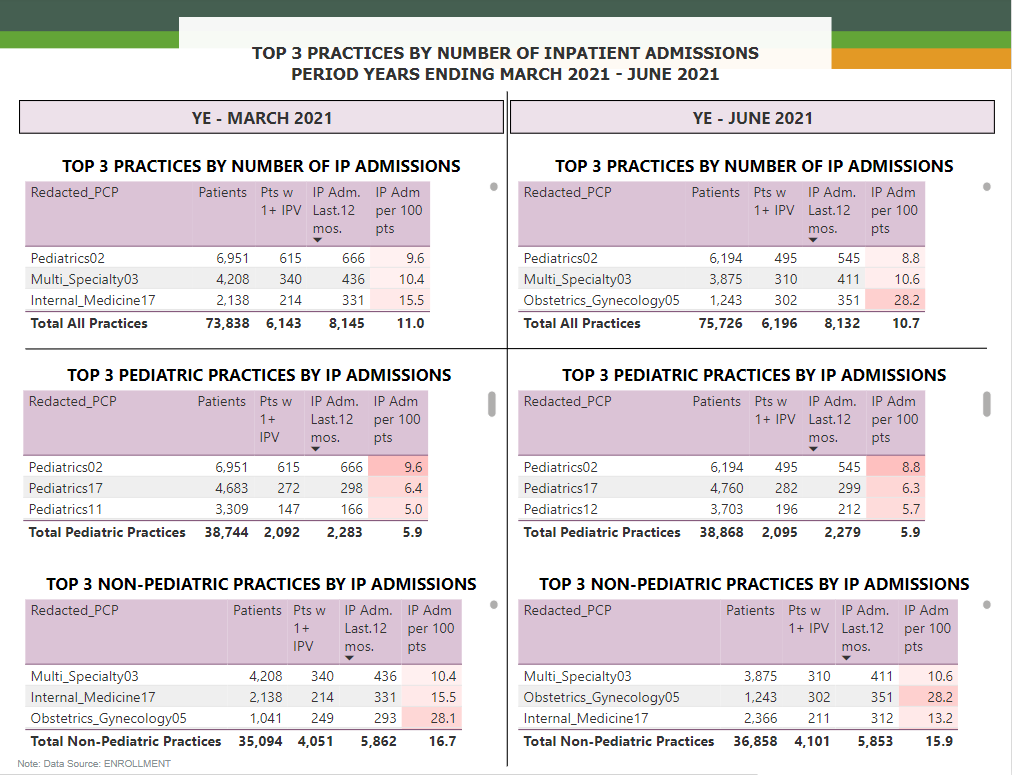 04_Top3_IP_Visits
 05_Top3_IP_Visits
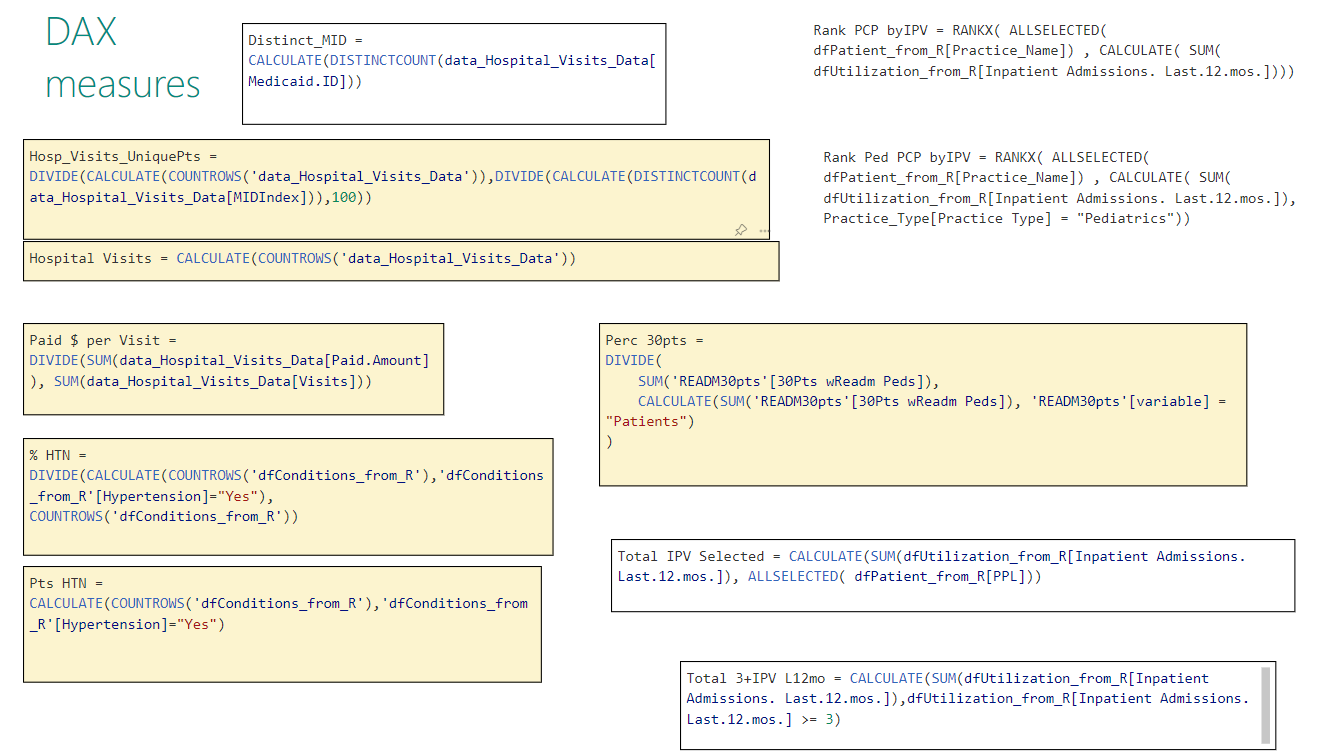 06_03_DAX_code_for_measures
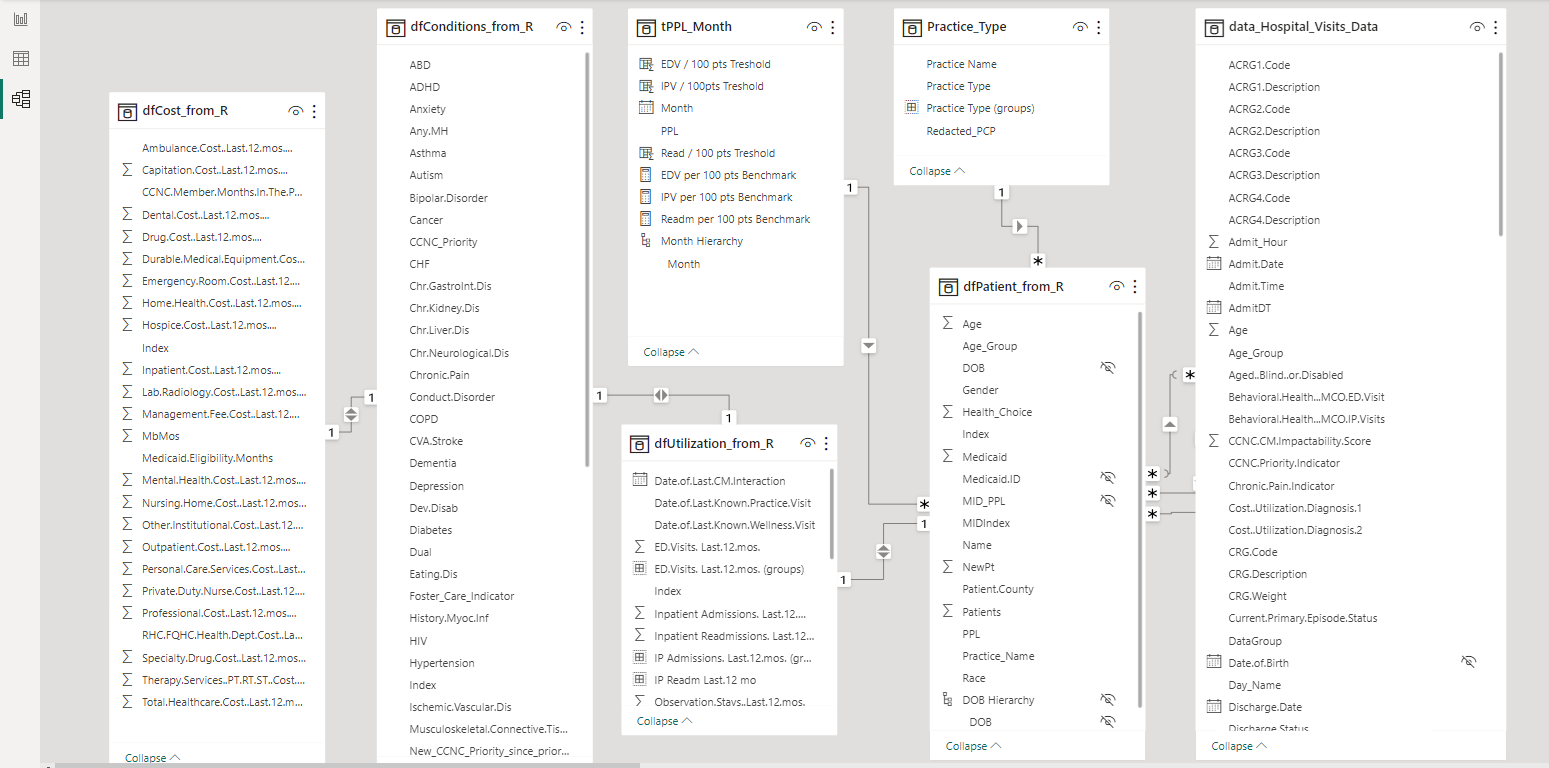 07_Model_View
04. Patients with ADHD indicator and Enrollees who received ADHD fills
Enrollment: August 2018.Report published: September 06, 2018. 1 page. Link: Patients with ADHD indicator and Enrollees who received ADHD fills
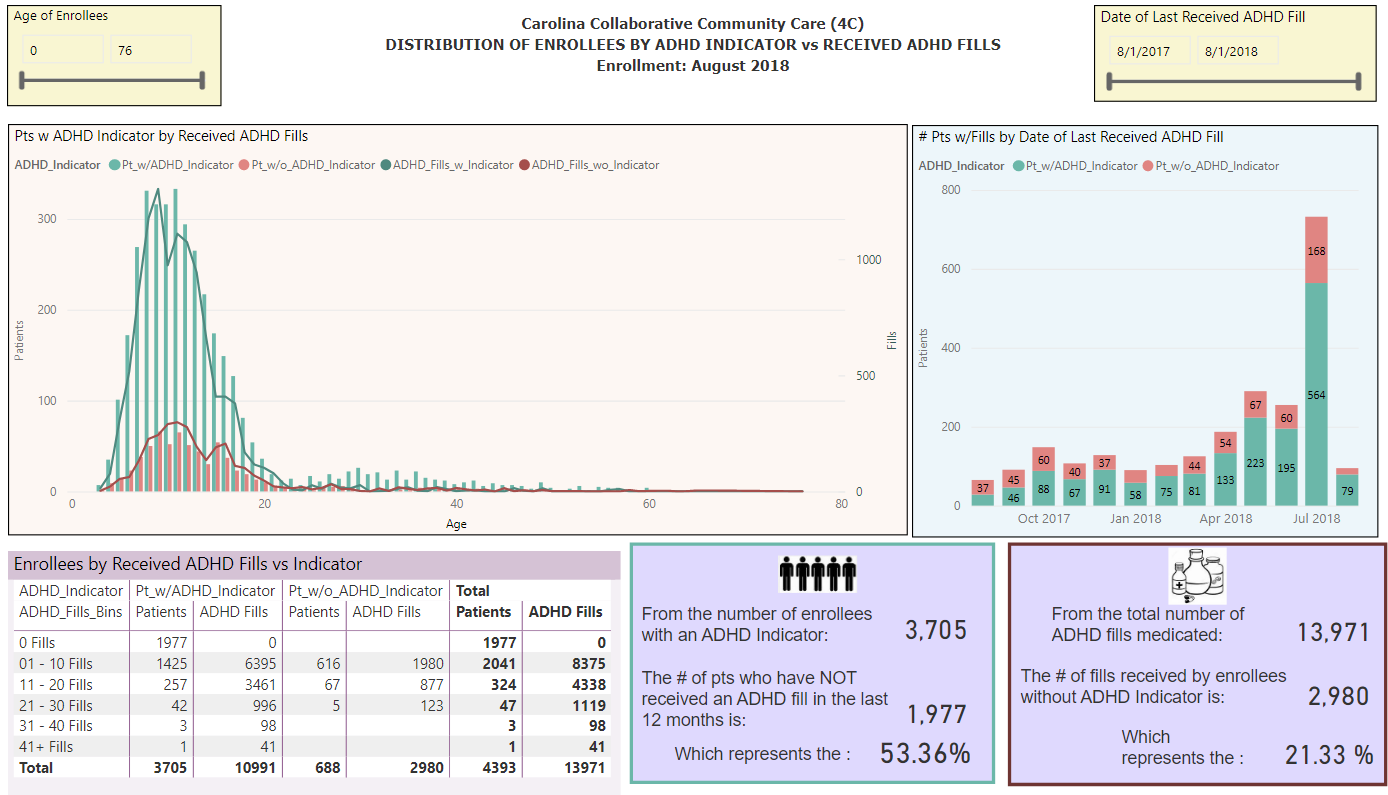 01_Patients with ADHD indicator and Enrollees who received ADHD fills